Quickly Create Amazing Infographics With NotebookLM from YouTube, Books, Sites & Notes

Have you ever struggled to turn a mountain of data into something that’s not only digestible but also visually captivating? In this new guide, Matt Penny explores how Google’s NotebookLM is transforming infographic creation, making it easier than ever to transform complex information into stunning visuals. Whether you’re a marketer trying to grab attention, an educator simplifying tough concepts, or a professional presenting key insights, NotebookLM offers a seamless way to create polished, audience-ready infographics. The best part? It’s completely free, proving that you don’t need a big budget to make a big impact. With its combination of automation and customization, this platform promises to save you time while elevating the quality of your visual storytelling.
This guide will walk you through the process of using NotebookLM to craft infographics that are not only visually appealing but also packed with meaningful, accurate data. From importing information from trusted sources to tailoring the design to suit your audience, you’ll discover how to use this intuitive platform to its fullest potential. Along the way, you’ll uncover tips for enhancing clarity, engaging your viewers, and making your visuals stand out in a sea of content. If you’ve ever wondered how to simplify data visualization without sacrificing quality, this is your chance to find out.
Create Infographics with NotebookLM
TL;DR Key Takeaways :
- NotebookLM is a free, cloud-based tool by Google that simplifies the creation of professional-grade infographics by integrating automation, customization, and accessibility.
- Users can import data from various sources like YouTube videos, books, websites, and research papers, making sure infographics are built on accurate and reliable information.
- The platform offers robust customization options, including layout, language, and design elements, allowing users to tailor infographics to their specific needs and audience.
- NotebookLM is versatile, catering to applications such as educational materials, marketing campaigns, content summarization, and business insights, making it valuable across industries.
- Key advantages include time efficiency, ease of use for all skill levels, and the ability to create visually engaging and precise infographics quickly and effectively.
What Is NotebookLM?
NotebookLM is a free, cloud-based tool that works effortlessly with your Google account. It allows users to create and manage notebooks filled with data sourced from a variety of platforms, including YouTube videos, books, websites, and research papers. Designed with an intuitive interface, it simplifies the process of organizing and visualizing data, making it accessible to users of all skill levels. Whether you’re a seasoned professional or a beginner, NotebookLM provides the tools you need to create professional-grade infographics.
How to Create Infographics with NotebookLM
Creating infographics with NotebookLM is a straightforward process that combines simplicity with flexibility. Follow these steps to get started:
- Import Data: Begin by importing data from your preferred sources, such as research papers, YouTube videos, or books. This ensures your infographic is built on accurate and relevant information.
- Customize Your Design: Select the language, layout (landscape, portrait, or square), and level of detail for your infographic. These options allow you to tailor the design to suit your audience and purpose.
- Generate the Infographic: Once your settings are finalized, NotebookLM generates a polished infographic that is both visually appealing and content-rich.
This process not only saves time but also ensures that your infographic is both professional and easy to understand, regardless of the complexity of the data.
How to Create Stunning Infographics with NotebookLM for Free

Check out more relevant guides from our extensive collection on NotebookLM that you might find useful.
- NotebookLM Alternative Open Notebook Lets You Build a Private AI
- Google AI for Marketing : Gemini 3, NotebookLM & Automations
- Google’s Latest NotebookLM AI Update Delivers Big!!
- How to use NotebookLM (Video)
- Stop Buying Extra AI Tools : Build a Simple Workflow System That
- New Google NotebookLM Update : Faster Research, Source
- Google Illuminate: AI Audio Learning for Modern Education
- How to Use Gemini 2.5 for Market Analysis and Data Visualization
- How NotebookLM’s Deep Research Mode Enhances Productivity
- 5 Excellent NotebookLM Features You’re Probably Not Using
Applications of Infographics
NotebookLM’s versatility makes it an ideal tool for a wide range of applications. Here are some practical ways to use it effectively:
- Educational Materials: Simplify complex subjects, such as scientific theories or technical processes, into clear and engaging visuals for students.
- Marketing Campaigns: Design professional-grade infographics for presentations, social media, or advertising campaigns to effectively capture and retain your audience’s attention.
- Content Summarization: Condense lengthy YouTube videos, books, or research papers into concise, visually digestible formats for easier comprehension.
- Business Insights: Present competitor analysis, performance metrics, or internal data in a clear and actionable format to aid decision-making.
These applications demonstrate the tool’s ability to cater to diverse needs, making it a valuable resource across various industries.
Customization and Editable Design Features
NotebookLM offers robust customization options, allowing you to create infographics that align perfectly with your goals. Users can adjust layouts, select specific design elements, and edit content after the infographic is generated. This flexibility ensures that your final product resonates with your intended audience. Whether you need to refine the color scheme, adjust the level of detail, or modify the layout, NotebookLM provides the tools to make your infographic truly your own.
Key Advantages of NotebookLM
NotebookLM stands out as a powerful tool for creating infographics due to its unique combination of features. Here are some of its key advantages:
- Time Efficiency: By automating the data visualization process, NotebookLM significantly reduces the time and effort required compared to traditional methods.
- Accuracy from Reliable Sources: The ability to import data directly from trusted sources ensures that your infographics are both credible and precise.
- Ease of Use: With its user-friendly interface, NotebookLM is designed to accommodate users of all skill levels, making it simple to create professional-quality visuals.
These advantages make NotebookLM an indispensable tool for anyone looking to create impactful infographics quickly and efficiently.
Real-World Use Cases
NotebookLM’s capabilities extend to a variety of real-world scenarios, showcasing its versatility and practicality. Some notable use cases include:
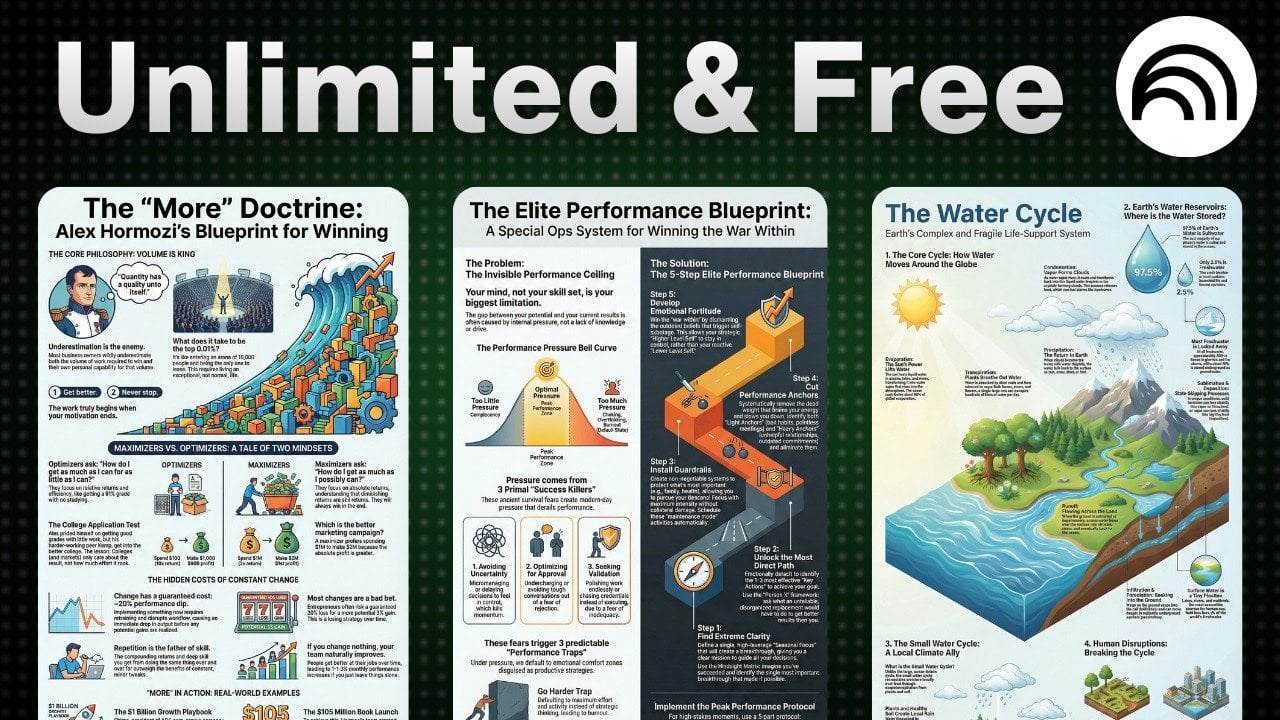
- Educational Use: Break down complex scientific processes, such as the water cycle or chemical reactions, into easy-to-follow visuals for students.
- Marketing Strategies: Develop engaging infographics to support campaigns, enhance social media content, or present product features in a visually appealing way.
- Research Summaries: Visualize key findings from books, research papers, or videos to make information more accessible and easier to understand.
- Business Analysis: Present data-driven insights, such as competitor comparisons, sales trends, or performance metrics, in a format that assists informed decision-making.
These examples highlight how NotebookLM can be applied across different fields to simplify complex information and improve communication.
Why NotebookLM Is a Valuable Tool
NotebookLM combines automation, customization, and source-based accuracy to simplify the creation of effective infographics. Its intuitive design and versatile applications make it an invaluable resource for professionals in education, marketing, research, and business. By integrating data importation, customizable design options, and a user-friendly interface, NotebookLM enables you to visualize information efficiently and effectively. Whether you’re summarizing a book, analyzing business data, or creating educational content, this tool ensures your infographics are both impactful and precise.
Media Credit: Matt Penny
Latest Geeky Gadgets Deals
Disclosure: Some of our articles include affiliate links. If you buy something through one of these links, Geeky Gadgets may earn an affiliate commission. Learn about our Disclosure Policy.